
Startup Board Financial Reporting: Examples, Templates, and Benchmarks
Board meetings are a vital aspect of your startup’s governance, serving as a key platform for aligning the strategic vision of the founders with the insights and expectations of the board. These meetings provide an opportunity to present financial performance, discuss challenges, and explore opportunities with the people who have a vested interest in your company’s success.
In this article, I will discuss best practices for building an impactful board financial reporting package to drive meaningful conversations with your board about your company’s financial performance:
- Determine the right data to share
- Optimize your presentation of the data
- Use a financial plan as the anchor for your financial reporting
- Synchronize your board and financial close calendars
- Maintain consistency and be efficient with your reporting
Step 1: Determine the Right Data to Share
The first step to preparing for a successful board meeting is selecting the right data to share. By providing board members with straightforward, relevant, and accurate financial information, you enable them to make informed decisions that drive the company forward. Clear presentations that highlight financial performance and relevant KPIs help keep discussions focused on what truly matters.
The appropriate reports and key performance indicators (KPIs) will vary depending on the company and industry, but at a minimum, you should include financial statements in your board presentation. As your company grows, your reporting will need to evolve to reflect new challenges and opportunities. The table below highlights some typical reporting that is included in board financial reporting packages, and how this may vary by the stage of the company. See the second half of this article for examples of these reports.
Financial Reporting for Board Meetings by Startup Stage
| Pre-Seed / Pre-Revenue | Seed / Initial Revenue | Series A+ | |
|---|---|---|---|
| Cash Runway | Include | Include | Include |
| Headcount | Include | Include | Include |
| Financial Statement | Include | Include | Include |
| Revenue | Not yet applicable | Include | Include |
| Key Metrics Reporting | Not yet applicable | Include | Include |
| KPI / Summary Dashboard | Not yet applicable | Not yet applicable | Include |
| BVA / Waterfall Reporting | Not yet applicable | Not yet applicable | Include |
The goal of your financial presentation should always be to foster transparency and facilitate meaningful conversations and decision-making. Tailor your presentation based on the composition of your board members, and solicit feedback from your board on what they want to see.
While it’s important to be thorough, you don’t need to walk through all the financial details during the meeting itself. Make the most of your meeting time by sending a pre-read document at least two days prior. This document should contain the necessary information for board members to review beforehand, but remember that not everything in the pre-read needs to be discussed during the meeting. Appendices can be particularly helpful for providing additional context without overwhelming the main discussion points.
Step 2: Optimize How You Present Data
Optimizing how you present financial data ensures clarity and facilitates understanding among board members. A well-structured presentation helps highlight key insights, making it easier to identify trends, evaluate performance against targets, and make informed decisions.
Numbers Need a Reference Point to be Meaningful
A (Poorly Made) Q1 2024 Dashboard
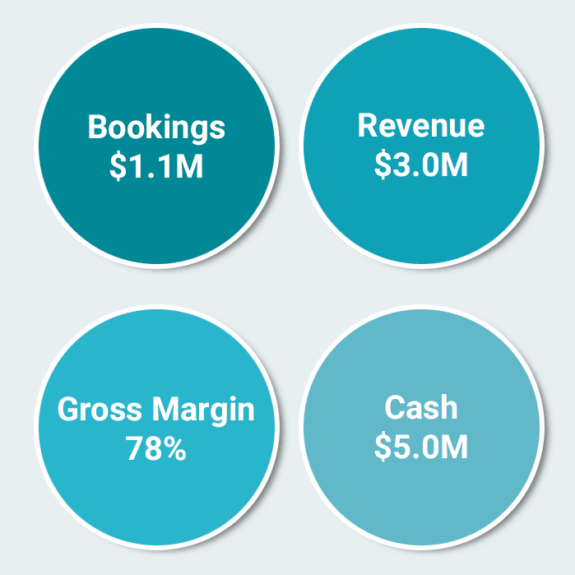
The dashboard above is not very helpful, as the numbers are presented standalone without any reference points to help contextualize whether performance is good or bad. For example, the company achieved $1.1M of bookings in the quarter, but was this higher or lower than what the company expected? And how does it compare to their bookings in recent quarters? When appropriate, compare presented numbers to projected targets and/or historical performance to provide meaningful context.
Choose a presentation format for each metric that best tells the story of company performance. Some good approaches to apply are graphs, tables and shading or other visual elements. At the same time, avoid filling charts with too many data points or elements, which can be over-complicated and confusing.
Graphs
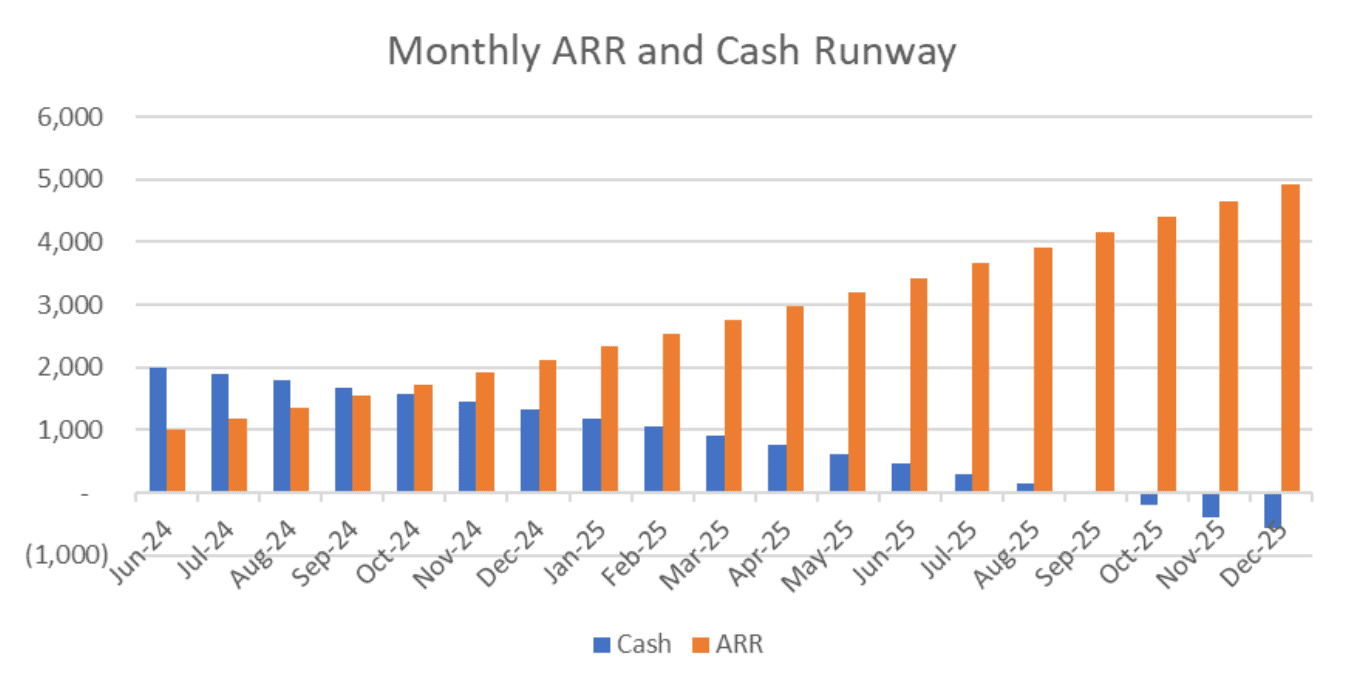
Graphs are ideal for showing trendlines for one or more metrics side by side.
Tables
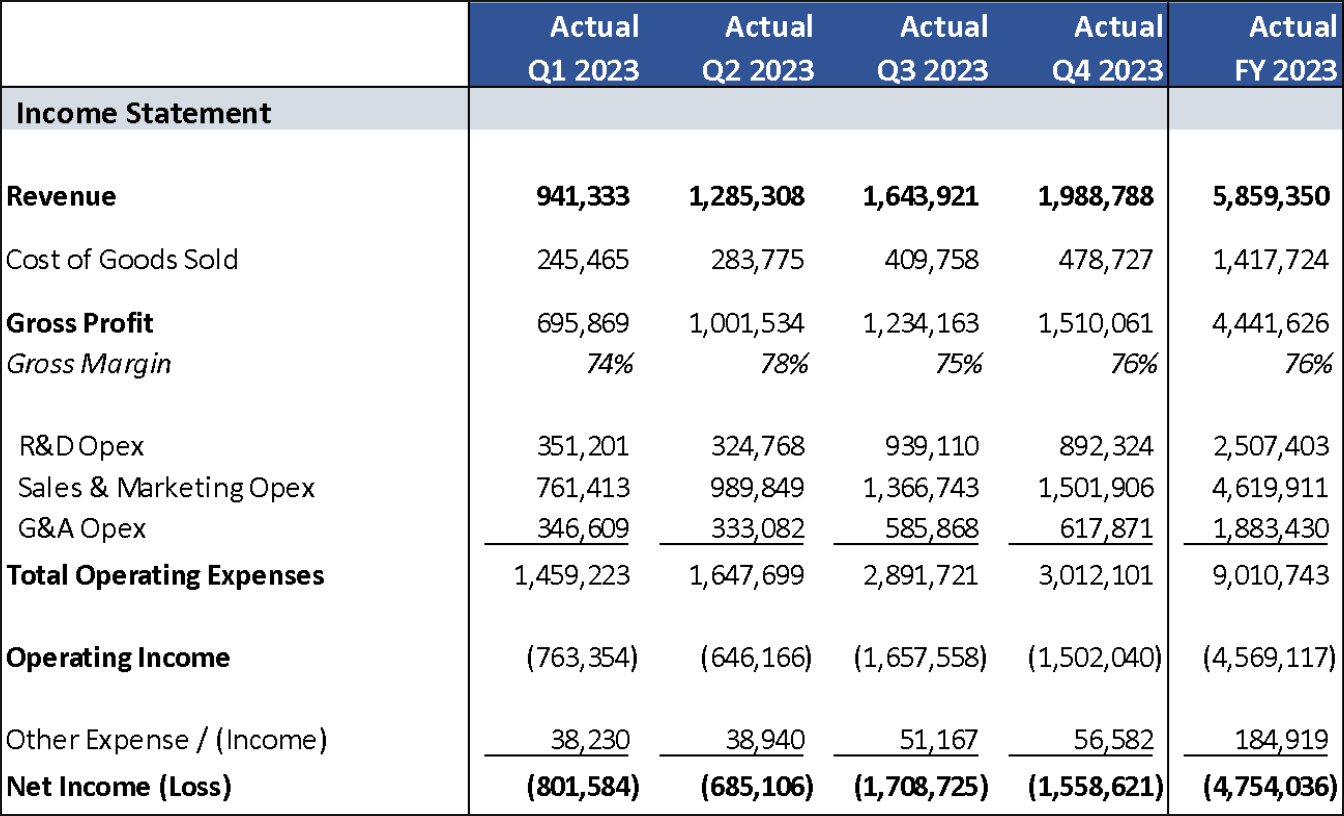
Tables are often ideal for displaying larger data sets (e.g. full financial reports) and budget vs. actual reporting.
Shading
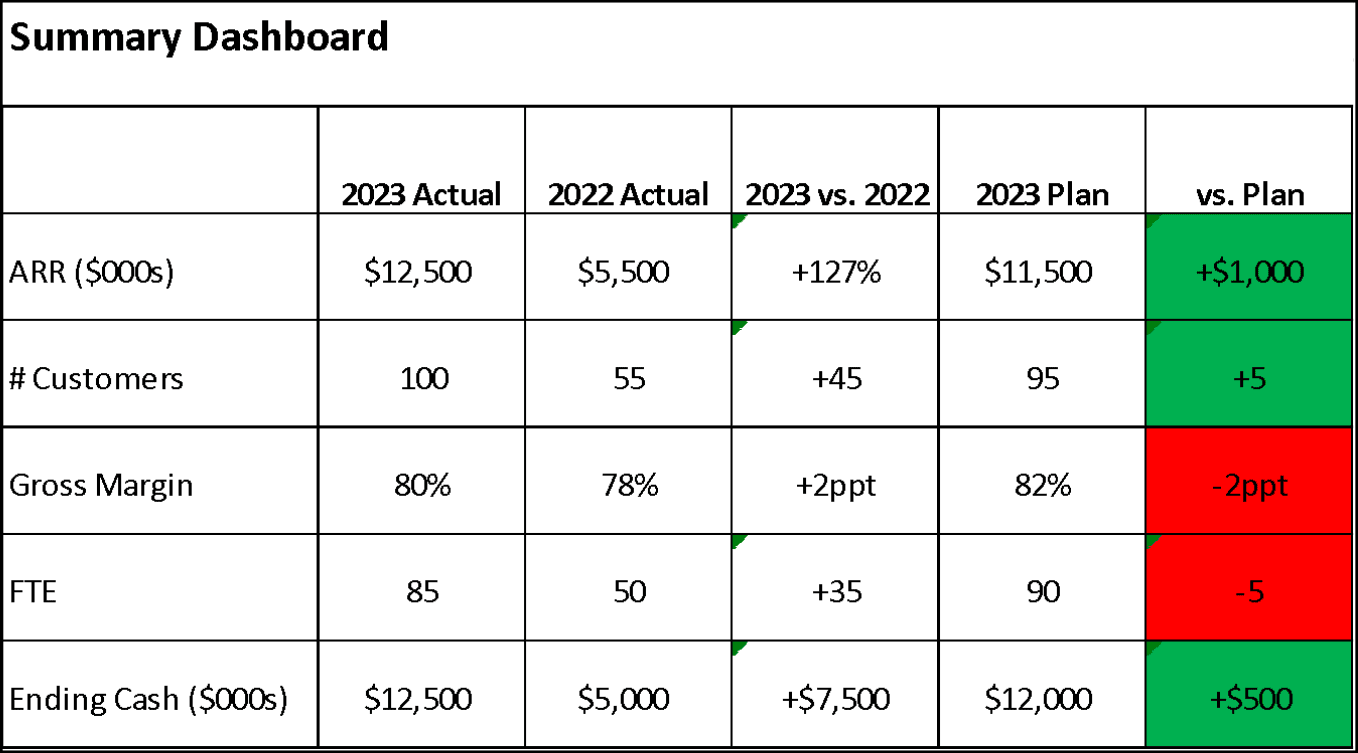
Use shading and other visual elements to summarize and highlight performance.
Don’t Cherry Pick Data!
It can be tempting to “cherry pick” and position data when preparing financial reports to make performance appear stronger. Don’t fall into this trap, as your board and prospective investors will lose confidence if they perceive a lack of honesty and full transparency. Choose a consistent presentation format that drives transparency, and don’t cherry pick data.
Step 3: Use a Financial Plan as a Reference Point in Board Reporting
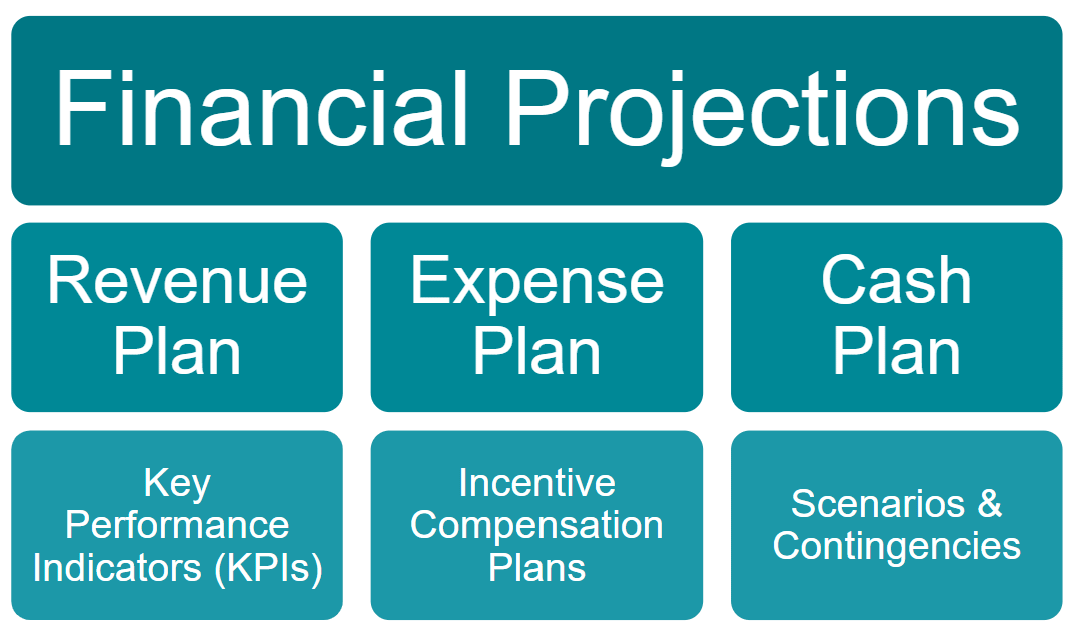
Most startups build an annual financial plan by the time they reach the late Seed or Series A stage. These financial plans become crucial as they enable companies to determine their cash runway, validate their revenue model and unit economics, and communicate their business model to investors. Financial plans also provide a benchmark to measure performance against goals, helping to identify when it may be necessary to pivot and adjust strategies.
An essential component of financial reporting is Budget vs. Actuals (BVA) reporting. This enables your company to track its performance against the financial plan, offering insights into how well you are adhering to your projected targets. By using the financial plan as an anchor in financial reporting, your startup can ensure that board reporting is structured, relevant, and aligned with the company’s strategic objectives.
Financial Plan Deliverables
Learn more about annual financial planning for your startup in my three-part blog series:
- Annual Financial Planning for Startups: Part-One, Preparation
- Annual Financial Planning for Startups: Part-Two, Projections & Plans
- Annual Financial Planning for Startups: Part-Three, Executing on Your Plan
Step 4: Synchronize Your Board and Financial Calendars
Target Scheduling Board Meetings on Week 4 of the Month
Aim to schedule board meetings during the fourth week of the month. This allows ample time for you to close out your books, analyze performance, prepare your deck, and distribute pre-read materials to your board members prior to the meeting.

| Accounting close: 10 business days | |
| Analyze performance, prepare board deck: 3+ business days before meeting | |
| Distribute board pre-read: 2+ days before meeting | |
| Board meeting: During 4th week of the month |
Schedule Quarterly Meetings After Financial Close
Schedule your quarterly meetings after the financial close of the previous quarter and tied to financial plan approval.
Example quarterly BOD schedule for Dec fiscal year-end company:

- January Meeting: Review prior year performance and finalize annual plan
- April: Review Q1 performance and updated full-year forecast
- July: Review Q2 performance and updated full-year forecast; consider whether it is time to pivot the financial plan
- October: Review Q3 performance and updated full-year forecast
- December BOD Call: Preview next FY plan
Step 5: Maintain Consistency and Be Efficient with Your Board Reporting
For board reporting, it’s best practice to mirror the reporting used by management, ensuring that the board has access to the same data your team relies on for making business decisions. This alignment promotes transparency and also drives efficiency, allowing you to leverage the same reports for management and board reporting and reduce redundant work. At times it can be beneficial to present reports at a higher level during board meetings to facilitate strategic discussions, but you should also recognize that some boards prefer detailed information. In such cases, including detailed reports in the appendix of board decks can satisfy the need for comprehensive data without overwhelming the main presentation.
Maintaining consistency in board financial reporting over time is also crucial for effective communication. It’s perfectly acceptable for the financial section of board reports to be “boring” or repetitive, as this consistency helps board members become familiar with how the reports are structured and what key metrics to focus on. Over time, board members learn to quickly interpret the reports and understand what to look for, making the review process more efficient and focused on strategic discussions rather than deciphering new formats or data presentations.
Ready to take the next step in preparing your financial reporting for board meetings? See part two for detailed examples of board financial reporting templates to give you ideas for how to effectively present data. These insights will help you ensure that your reporting is timely, relevant, and impactful, further enhancing the quality of your board discussions and decision-making processes.
Financial Reporting by Startup Stage
As we’ve seen in the first part of this article, the appropriate reports and key performance indicators (KPIs) will vary depending on your company and industry, but at a minimum, you should include financial statements in your board presentation. As your company grows, your reporting will need to evolve to reflect new challenges and opportunities. The table below highlights some typical reporting that is included in board financial reporting packages, and how this may vary by the stage of the company.
Let’s take a more detailed look at some examples of the reports listed above.
1. Cash Runway
Your cash runway projection should ideally be based on your monthly financial model, but you can also extrapolate based on current monthly cash burn if a monthly forecast isn’t available. You need to ensure the timing of your next anticipated fundraise matches with the expected attainment of required milestones. It can be helpful to present your cash runway alongside revenue attainment. This way, you’ll have a better sense of whether you will have achieved necessary growth milestones to raise a new round of capital prior to running out of cash.
2. Headcount
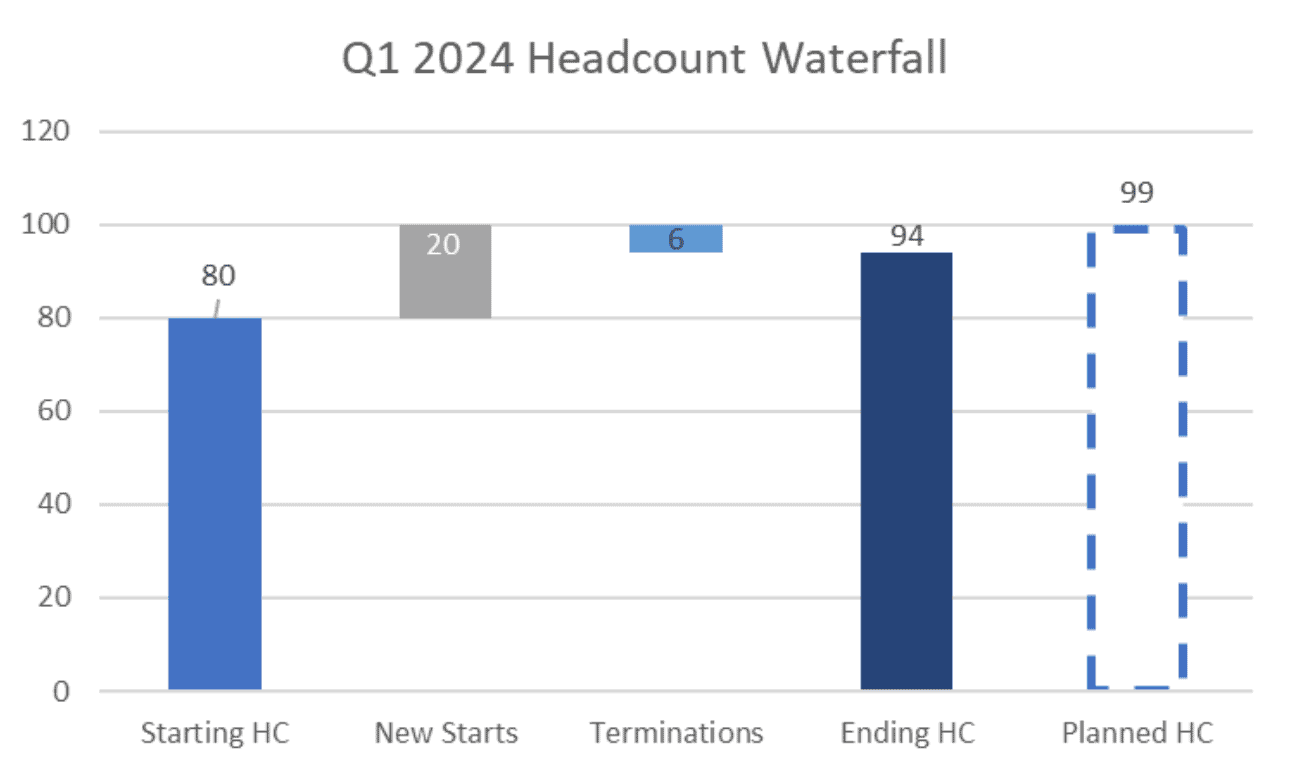
For many startups, people costs are the most significant expense category, making headcount a key report at all stages of growth. Boards like to review headcount reports, as staffing is an important lever to manage company expenses.
Tracking headcount can be tricky, as it isn’t included as part of the company’s accounting records in QBO or similar systems. Most early-stage startups manually track headcount in Excel or Google Sheets and switch to systems-based solutions as they scale. Whatever tools you’re using to track headcount, make sure to retain a history. This can be particularly valuable if you decide to change payroll providers.
It’s often useful to break out headcount reporting by department and/or geography.
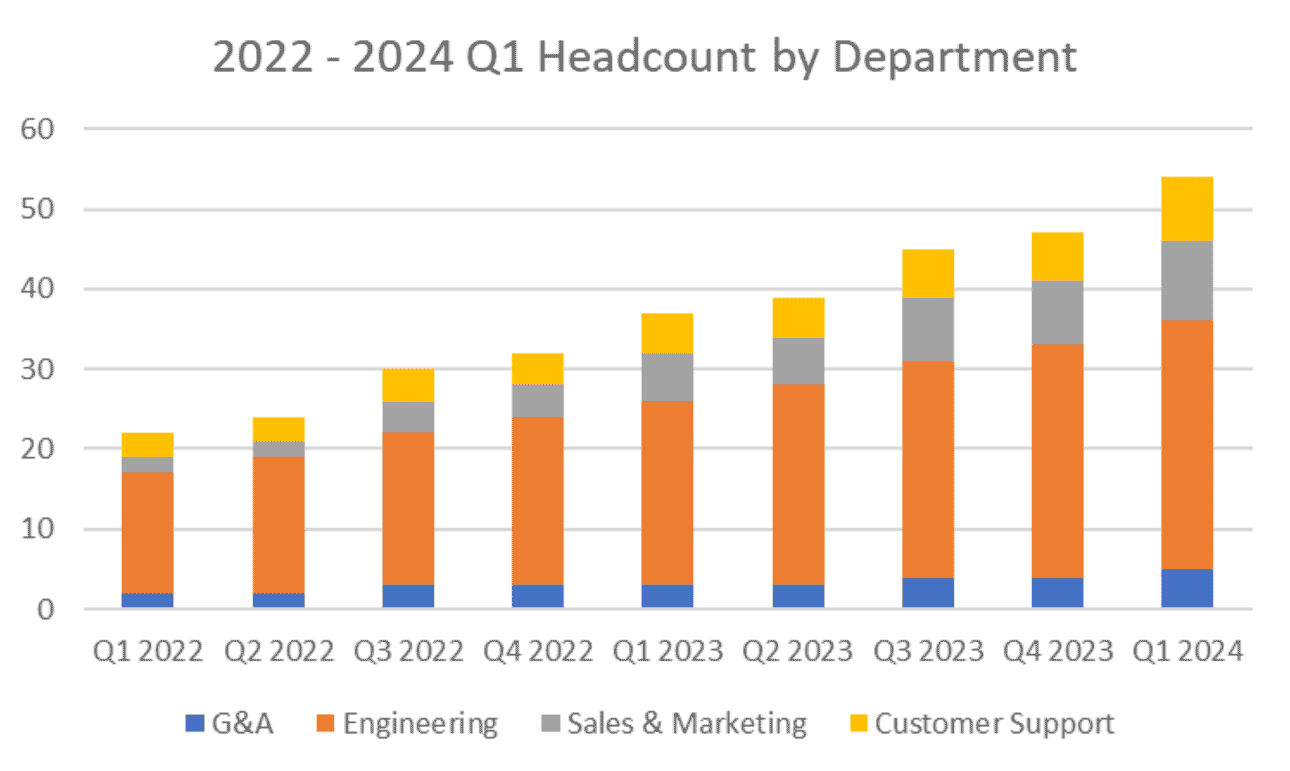
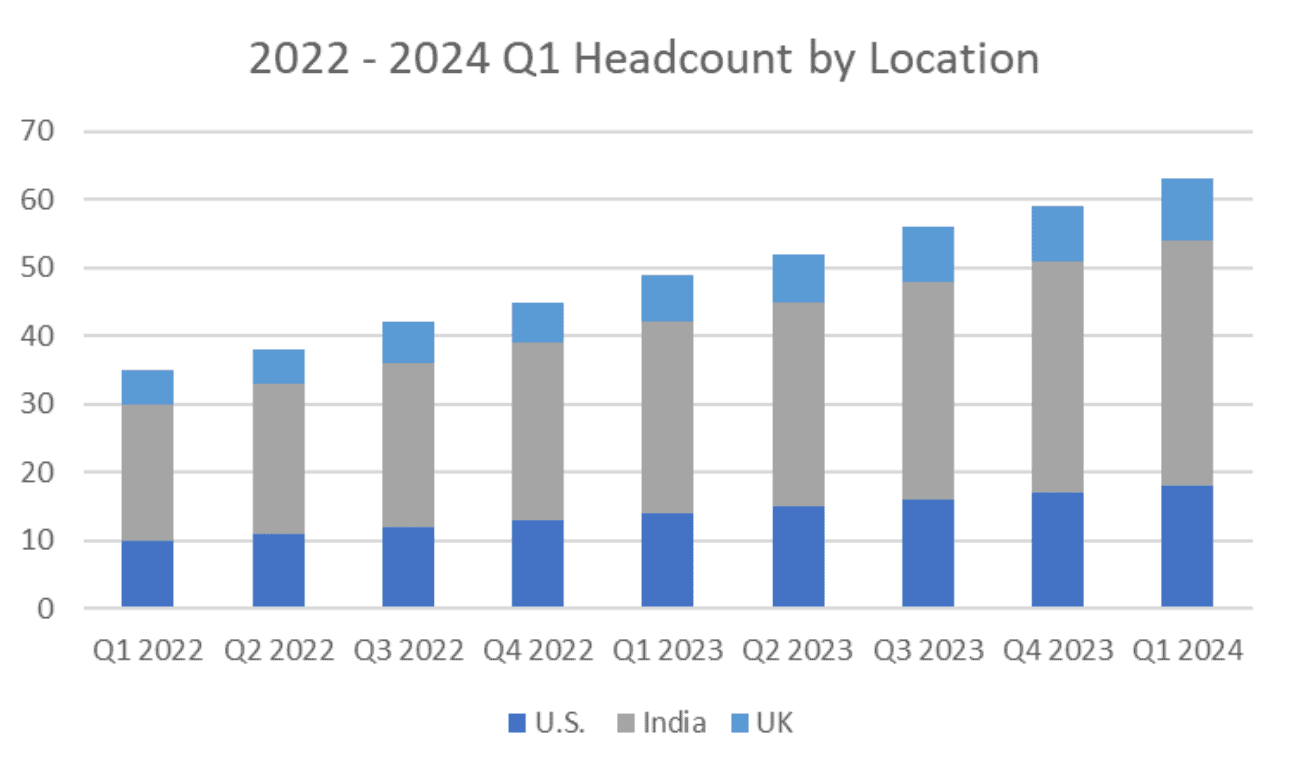
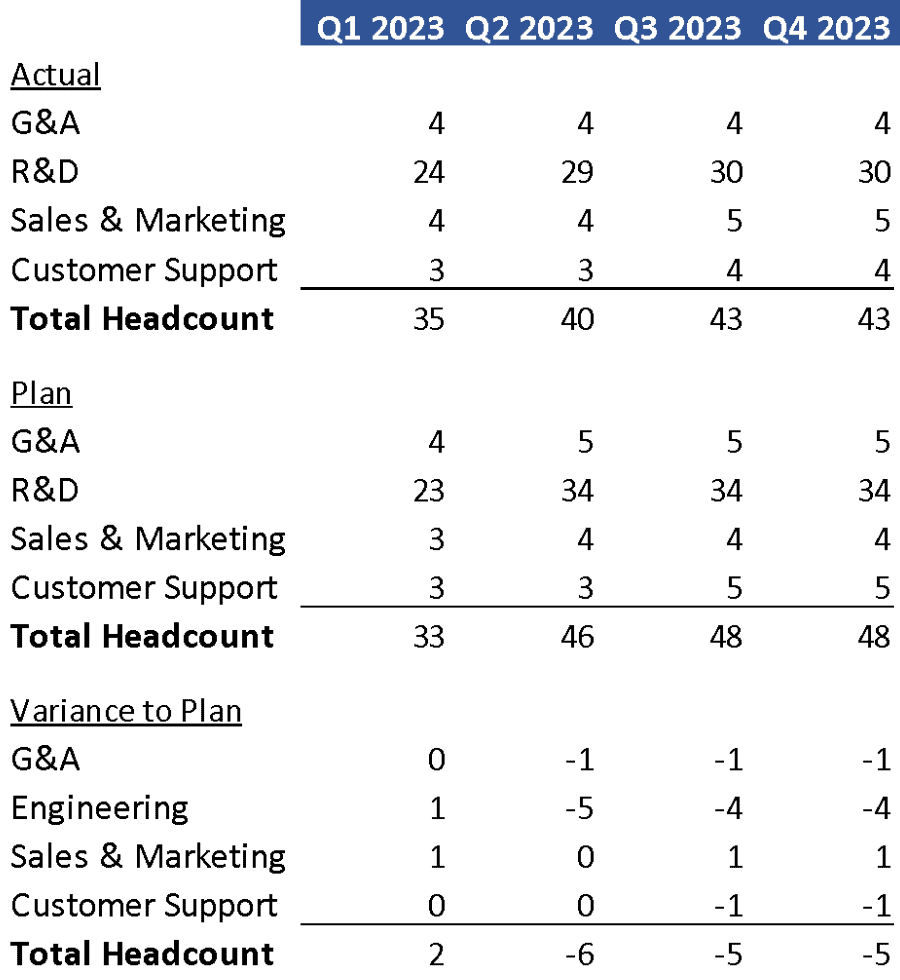
It’s also helpful to look at both hiring trendlines and comparison to plan.
2023 Actual Headcount vs. Plan
3. Financial Statements
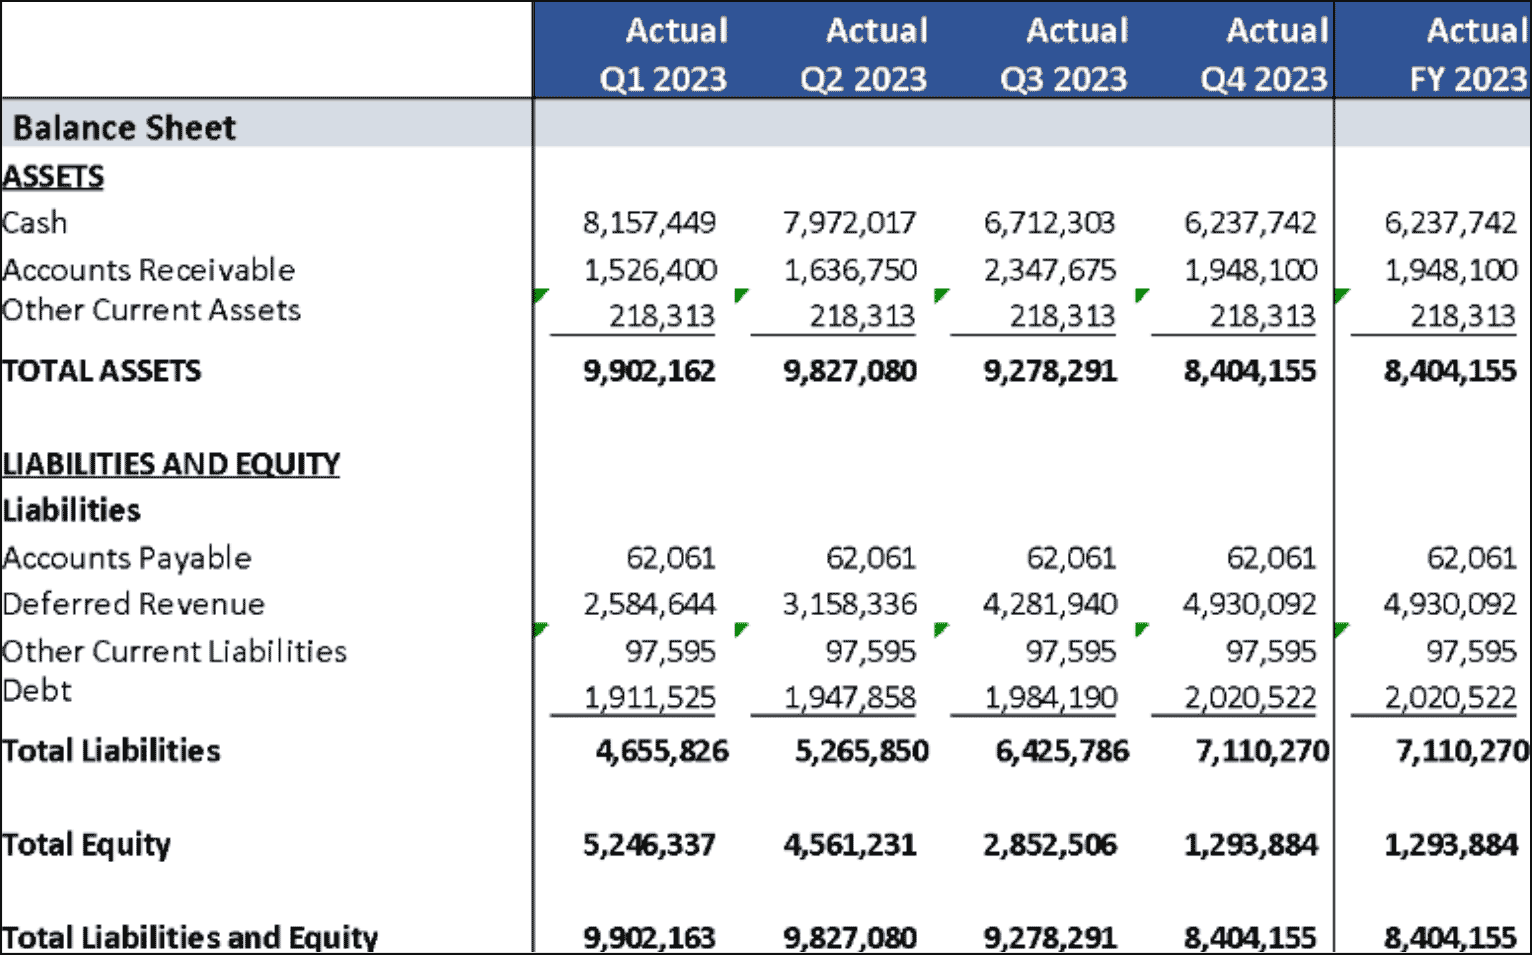
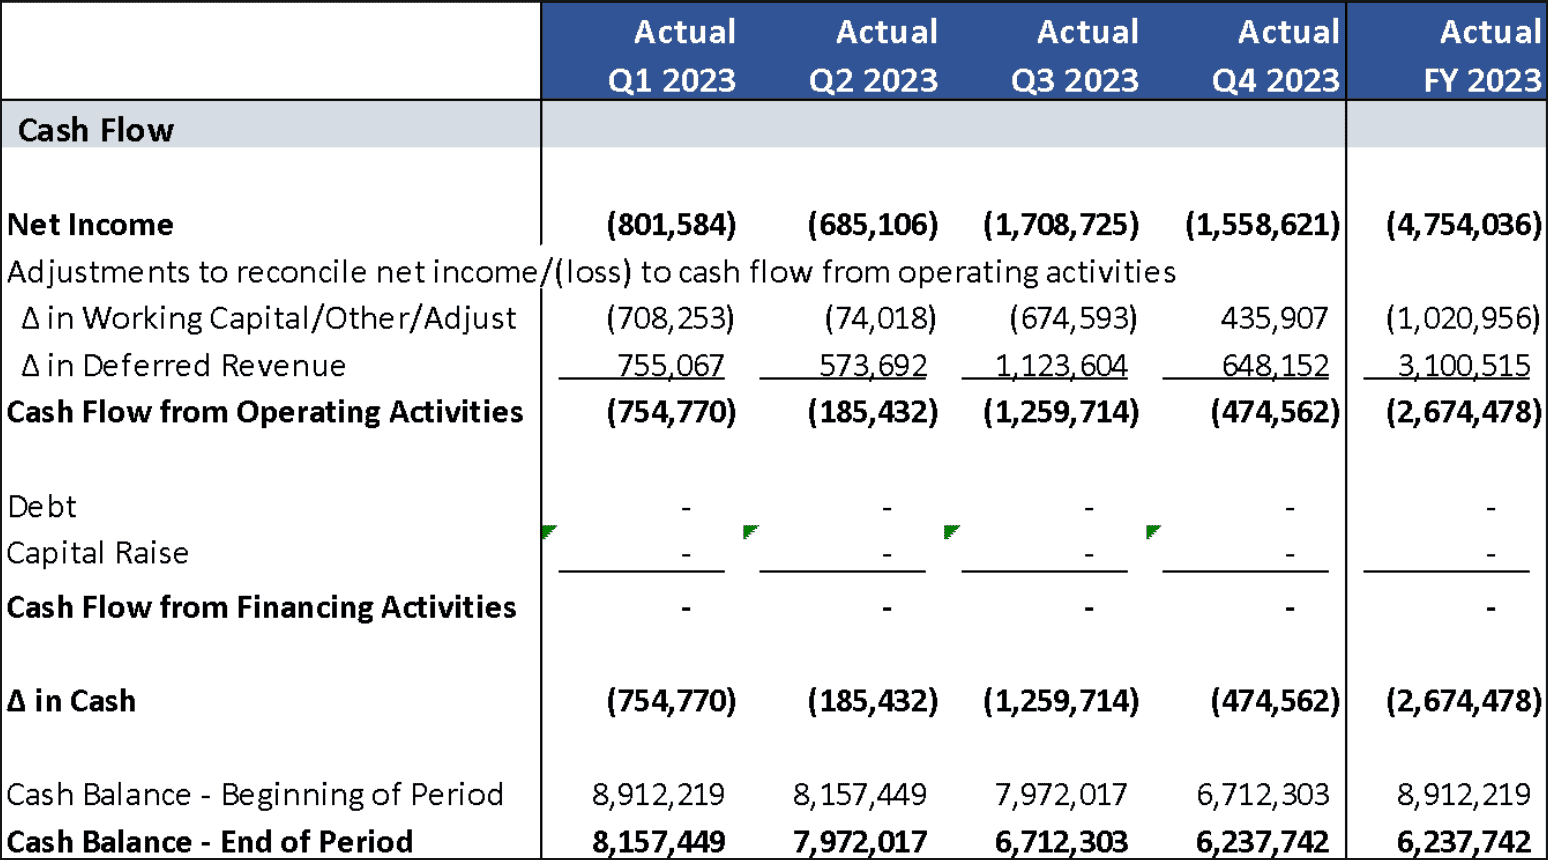
Your board financial reporting package should include your income statement, balance sheet and cash flow statement, presented on a monthly or quarterly basis. Financial statements presented to your board should be summarized from reports pulled from your core financial systems.
Income Statement
Balance Sheet
Cash Flow
It’s essential to implement accrual accounting procedures and ensure you maintain an appropriate chart of accounts that breaks out the following key income statement metrics: Revenue, Cost of Sales, Gross Profit, Opex, Operating Income, and Net Income. Your Opex should ideally be segmented between R&D, G&A, and S&M expenses. This requires your accounting system to be set up to break out department expenses.
4. Revenue
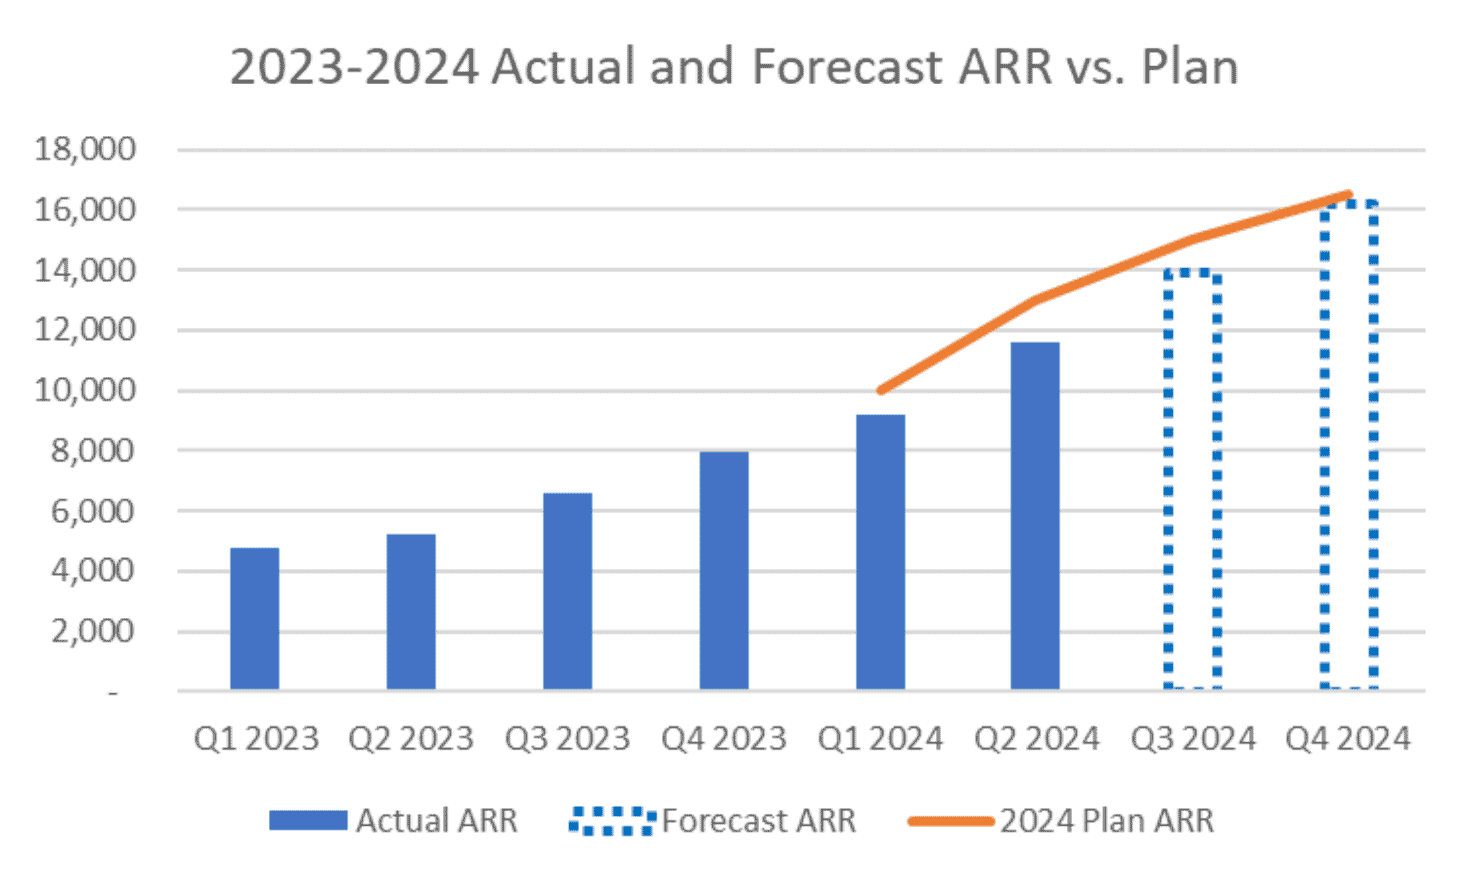
If your startup is generating revenue, show revenue and revenue growth segmented by relevant categories. It’s often helpful to present your revenue data in line or bar graphs to visually show trendlines of revenue growth over time. Add commentary regarding growth drivers (e.g., key accounts closed), variances to planned growth, and upticks/downticks in growth rates.
Useful breakouts often include business/product segments or geographic areas, and it can be helpful to add growth rates.
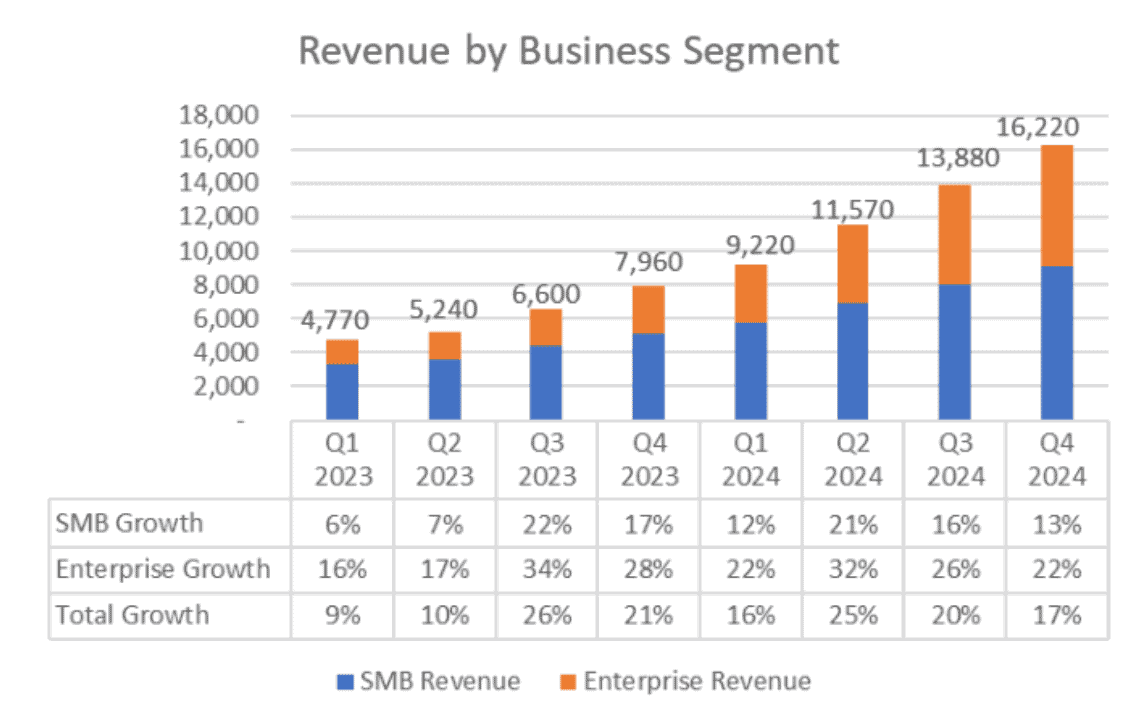
It can be helpful to add reference points such as performance vs. plan.
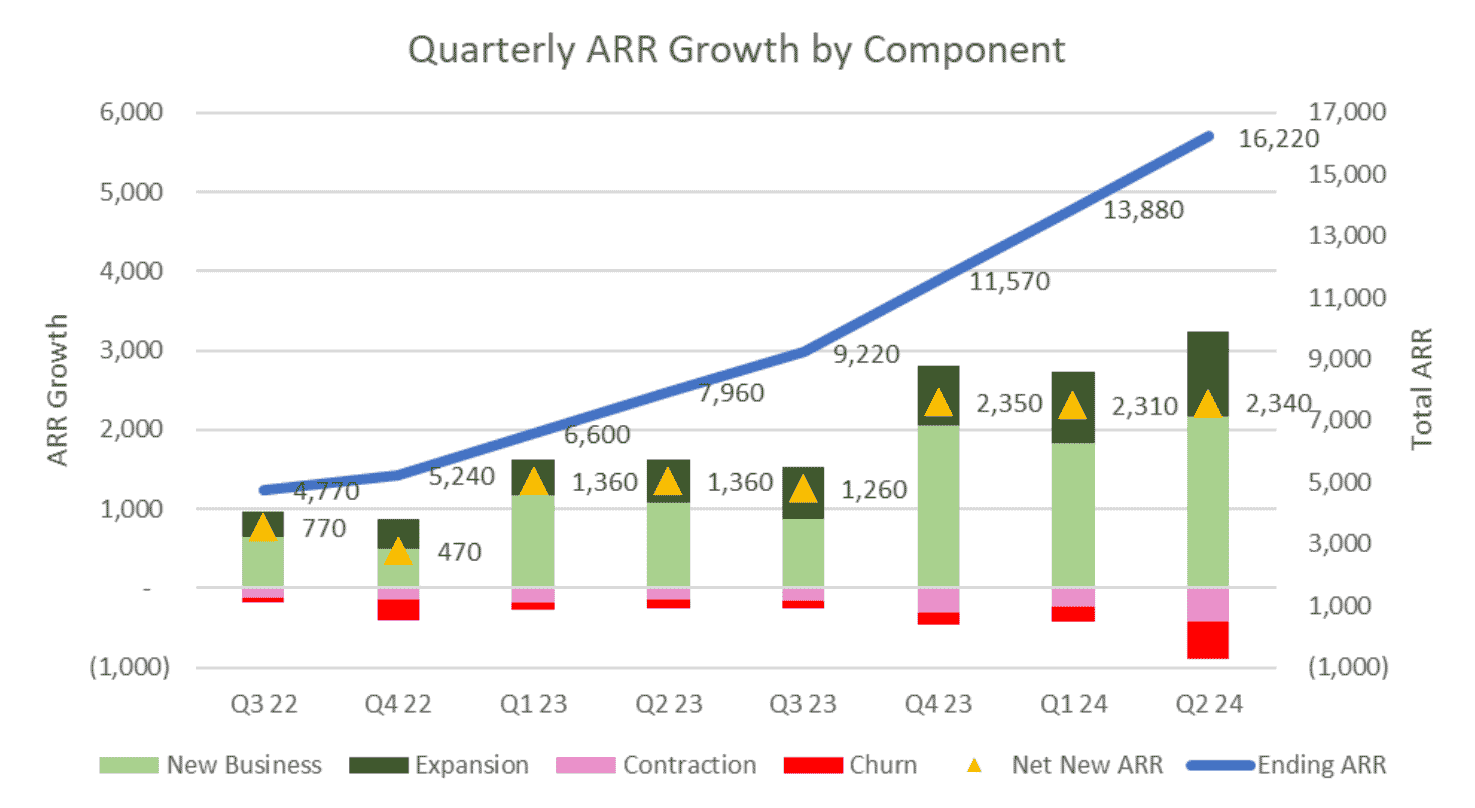
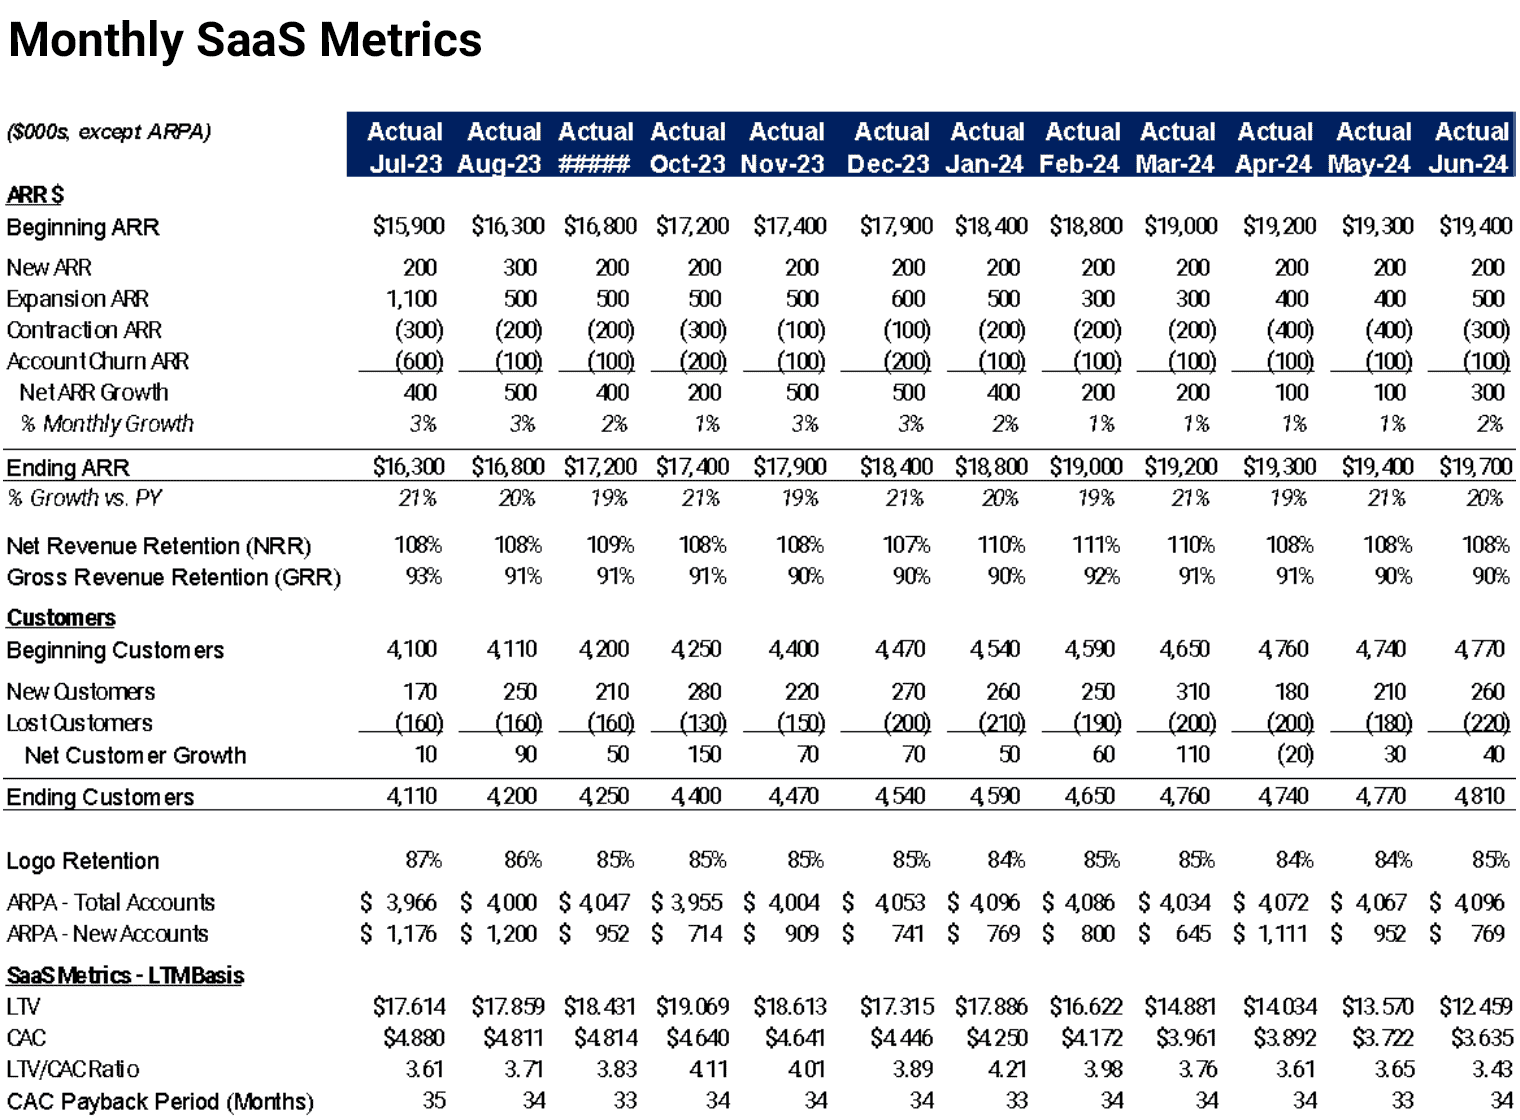
For SaaS companies, it’s often better to look at ARR than Revenue, and it can be helpful to break out the components of ARR growth (e.g. new business, expansion, contraction, churn)
5. KPI / Summary Dashboard
As your company grows, it becomes helpful to share KPI dashboards at your board meetings.
If your executive team uses a KPI dashboard, it is helpful to share that with the board.
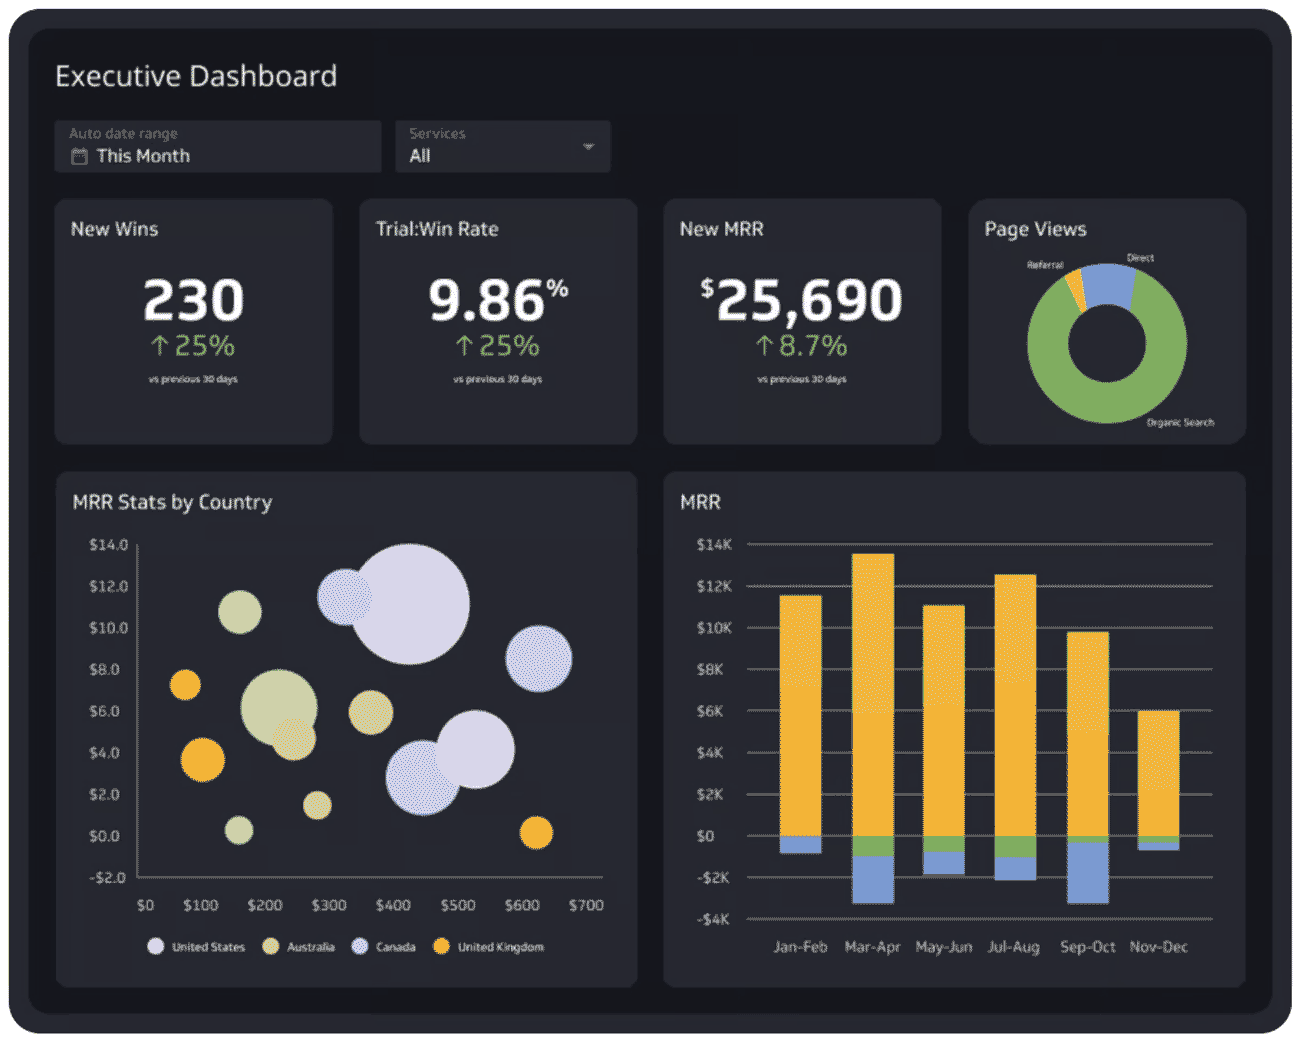
It can be helpful to include a summary dashboard of performance against the most important KPIs in the introduction to the board deck or at the beginning of the finance reporting section.
6. Budget vs. Actual (BVA) Reporting
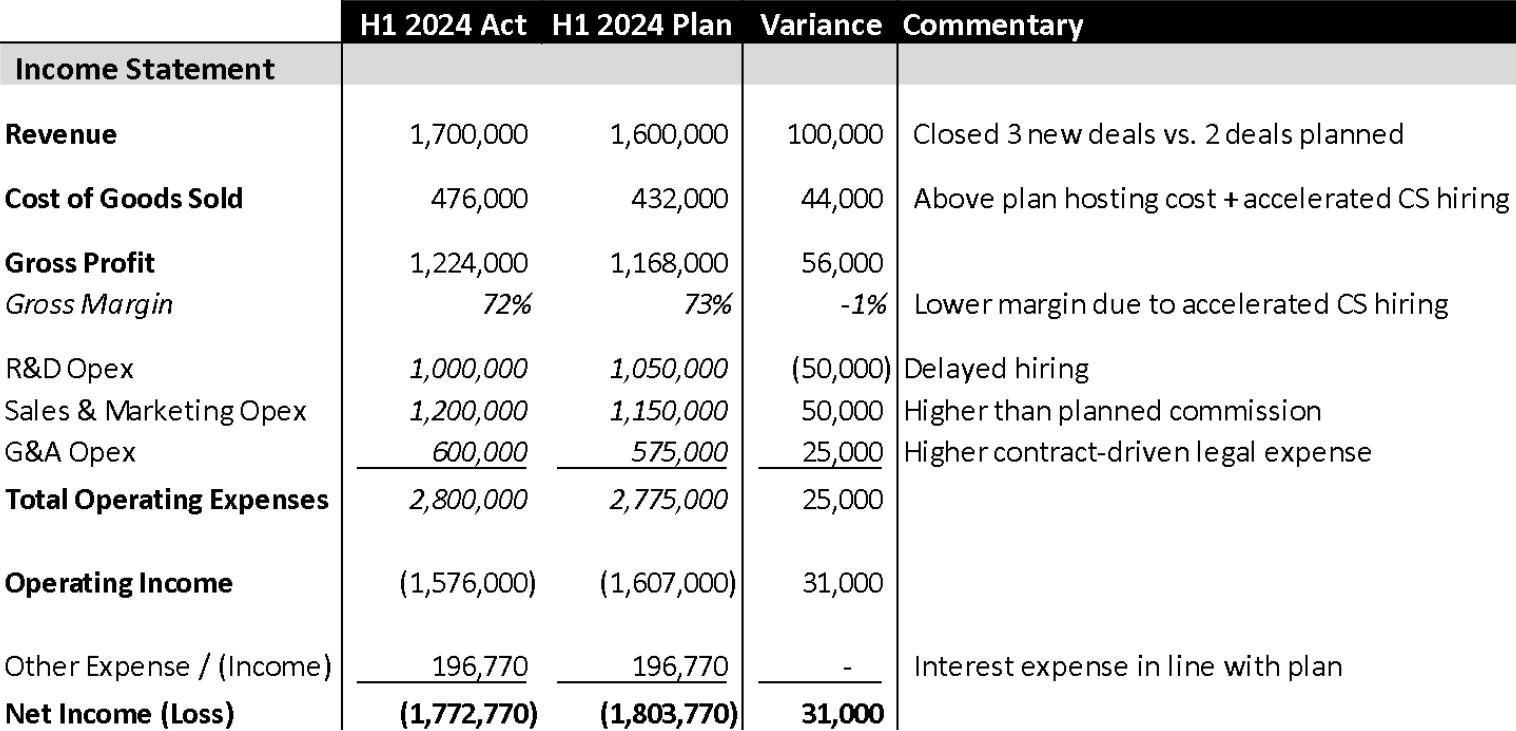
If your company has a financial plan (budget), it can be useful to review financial performance YTD in comparison to the YTD plan and explain the drivers of variances.
Quarterly P&L and FY P&L vs. Plan
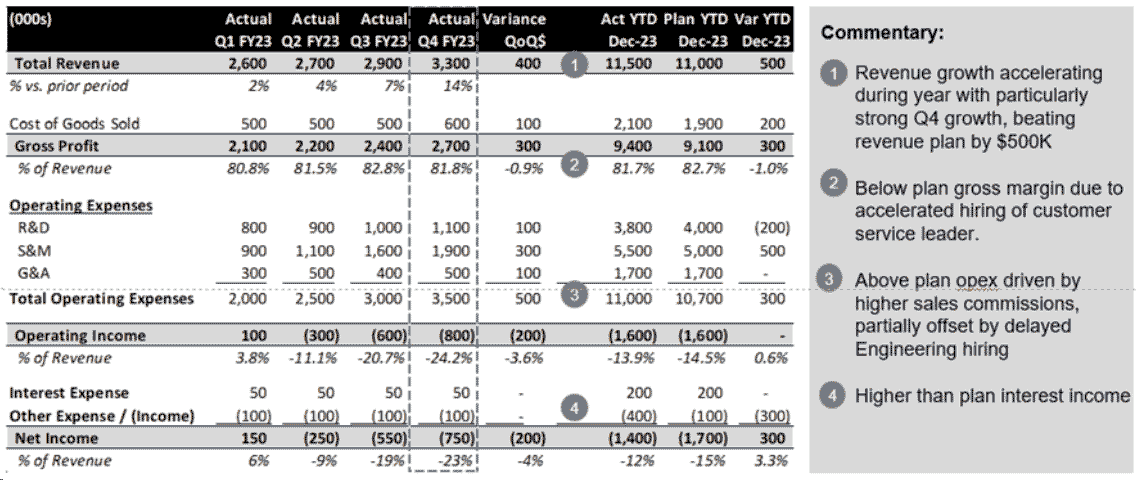
If you update your full-year forecast intra-year, it’s also helpful to compare the updated full-year forecast to the plan. It typically makes sense to include BVA reporting on your income statement. It can also be helpful to show BVA for cash flow or at least ending cash balances.
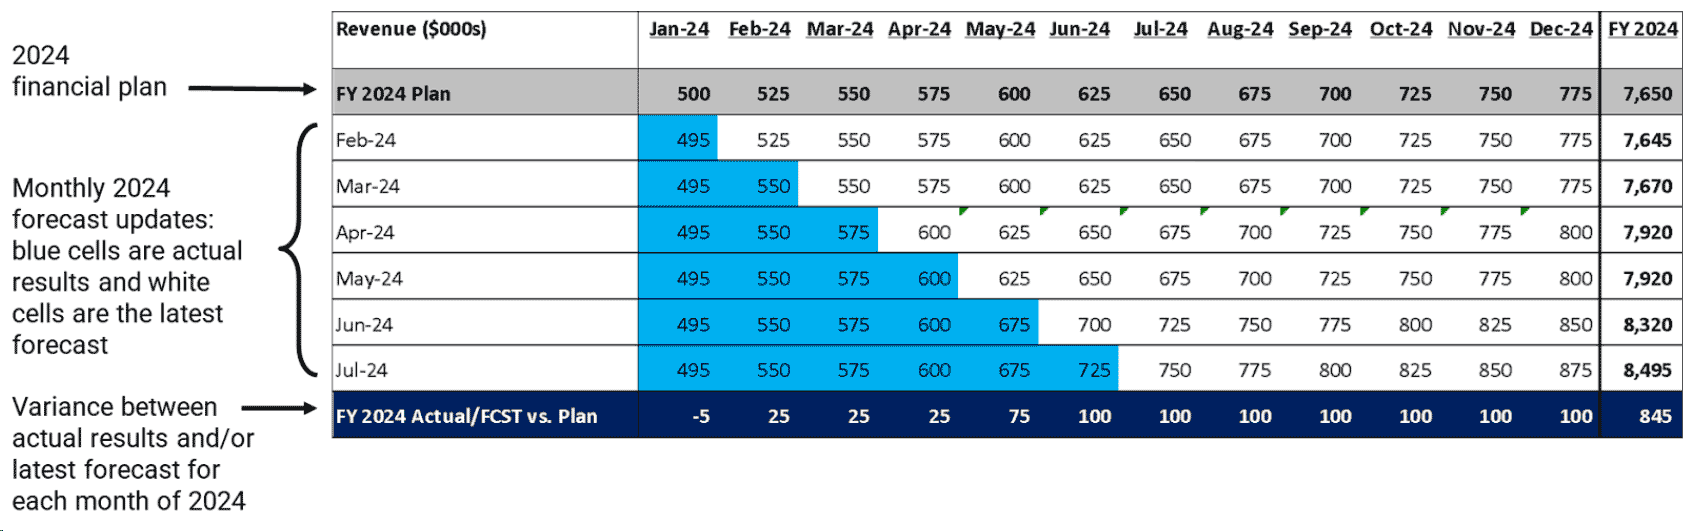
A waterfall analysis is another variant of BVA reporting that tracks monthly/quarterly performance and forecast movements over time. It’s helpful to prepare waterfall schedules for key financial metrics (e.g. ARR, Revenue, Expenses, Cash).
7. Key Metrics Reporting
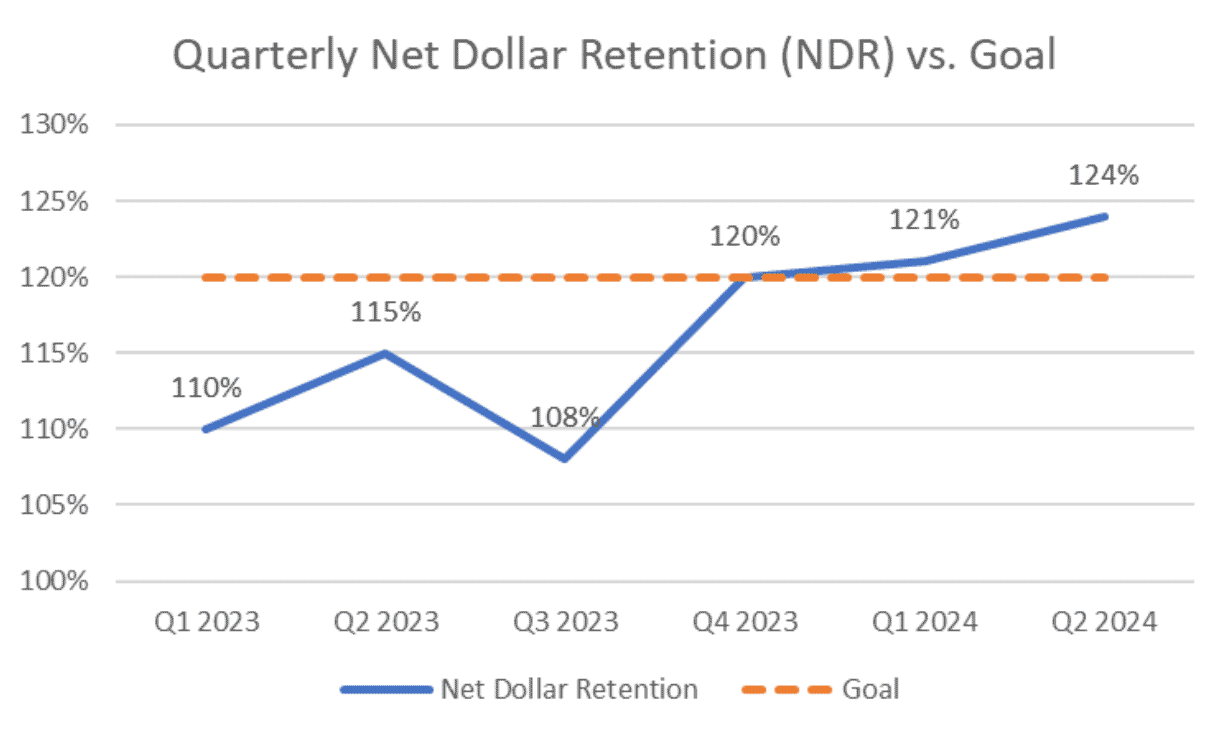
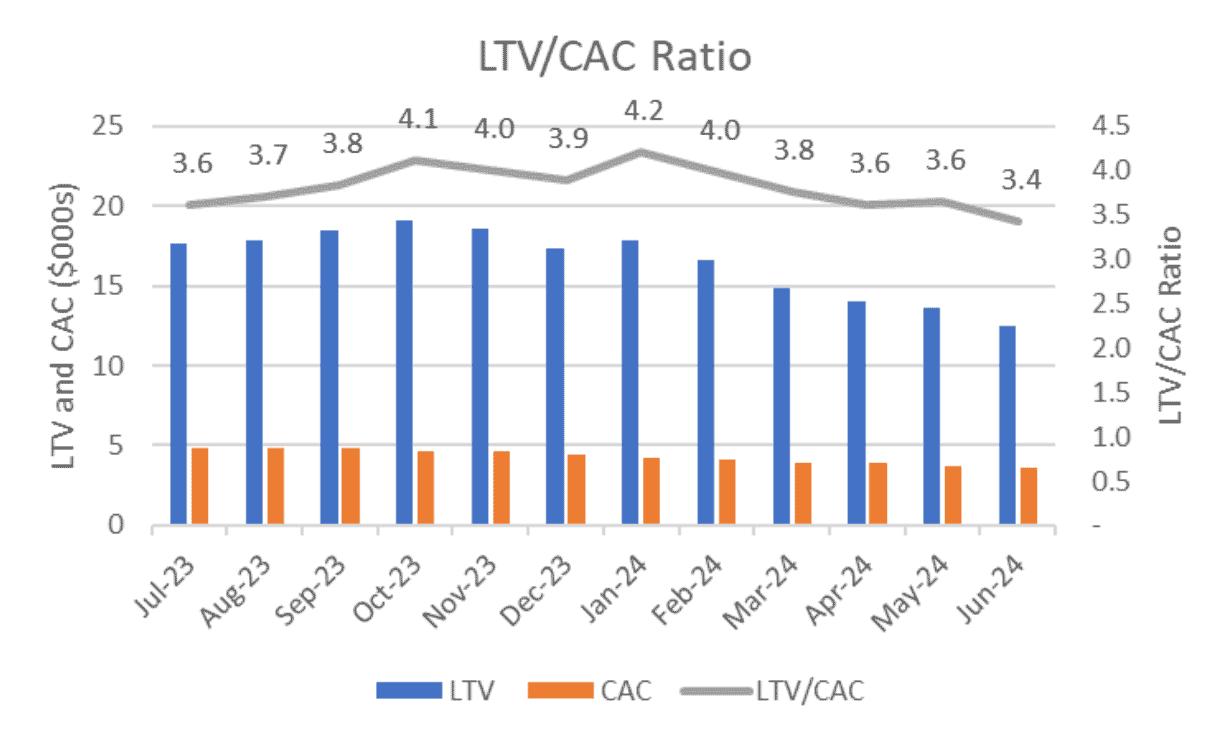
Finally, be sure to present trends for other key metrics relevant to your company and industry.
Ensure your board meetings are as effective and impactful as possible by partnering with Burkland’s fractional CFO services. Our team of experienced financial experts will help you streamline your financial reporting, maintain consistency, and present data in a way that drives strategic decision-making. Whether you need support in aligning management and board reports, preparing detailed financial analyses, or simply ensuring that your financial section is both accurate and clear, Burkland has the expertise to elevate your board presentations. Contact us to learn how we can help you optimize your financial reporting and keep your board fully informed and engaged.