Key takeaways:
- AI-core products grew fastest across every ARR band; slightly lower gross margins were offset by stronger Rule of 40 performance.
- Lean teams are the new normal. ARR per employee is up since 2022 while headcount is down at $5M+ ARR.
- The winning combo? High NRR plus short CAC payback. It’s the clearest path to better growth and Rule of 40.
- Outcome-based AI pricing is fueling top-line growth; hybrid (subscription + usage) models are delivering best-in-class NRR.
High Alpha’s 2025 SaaS Benchmarks Report is in its ninth year and draws on the largest dataset yet, with insights from 800+ SaaS companies around the world. The report is produced in partnership with Customers Bank, Growth Unhinged, and Visible. It’s built for operators and VCs alike, with key metrics, clear benchmarks by ARR band, and enough context to understand what “good” and “great” look like today.
This year’s analysis spans companies from sub-$1M ARR to $50M+, with breakouts by growth, efficiency, pricing model, and company structure. If you’re planning 2026 targets or pressure-testing a fundraise narrative, it’s one of the most useful reality checks you can get.
Here are five important takeaways for founders:
1. Good vs. Great SaaS Metrics
One of the first charts in the report compares “Good” (median) and “Great” (upper quartile) performance on five core metrics across five ARR bands. This is an incredibly valuable scorecard for targets and financial modeling. Don’t plan in a vacuum. Set goals and projections relative to where peers perform at your scale.
2025 SAAS BENCHMARKS DATA

Source: 2025 SaaS Benchmarks Report by High Alpha
💡Founder play: pick two metrics you’ll move this quarter. If Rule of 40 is lagging, decide whether the constraint is growth, margins, or both. Then line up one project per constraint with clear owners and a 90-day finish line.
2. VC Deal Activity in 2025

Source: Q3 2025 Pitchbook NVCA Venture Monitor
A notable chart from the report shows that VC deal value has returned to near 2021 levels this year (about $80B per quarter).
However, this comes with the important caveat that dollars are concentrated in fewer, larger deals—more than half of which have gone to AI startups. AI startups are also seeing significantly larger rounds; around $40M on average, compared to about $10M for non-AI startups.
3. AI SaaS Startups Outperform on Growth Rate
Not only are AI startups winning larger investment rounds, they’re also growing significantly faster across all ARR bands.
GROWTH RATE FOR AI CORE VS. SUPPORTING
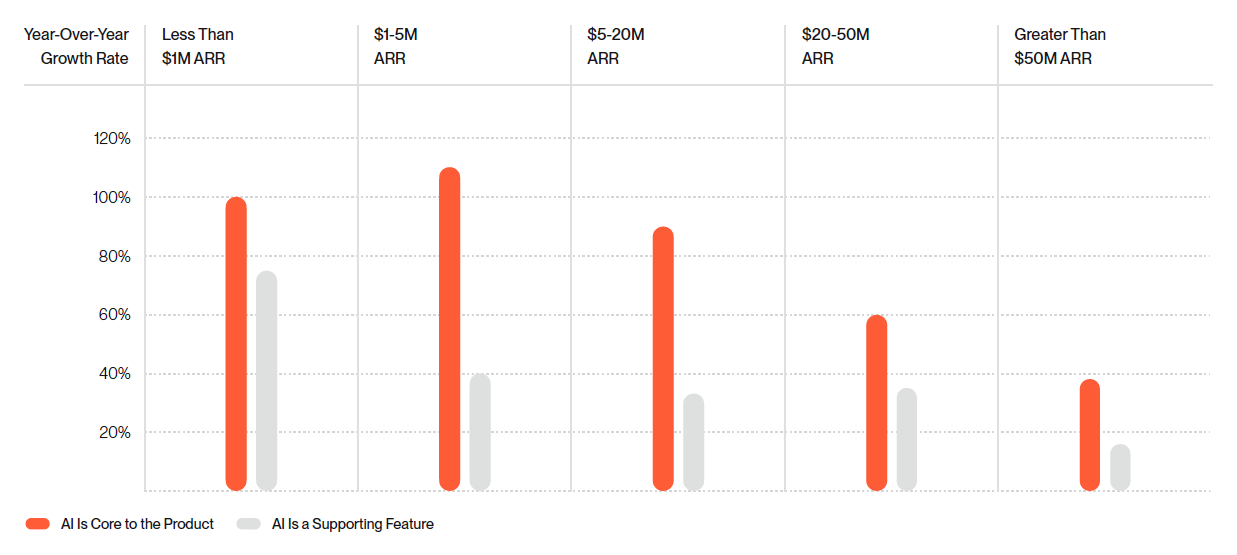
Source: 2025 SaaS Benchmarks Report by High Alpha
Outcome-based AI startups that charge based on results or value generated by the AI have seen particularly strong growth rates, while those with hybrid (subscription + usage based) pricing models saw strong Net Revenue Retention (NRR).
Not surprisingly, AI-core SaaS companies run about five points lower on gross margin, largely from compute costs. On a Rule of 40 basis, though, faster growth more than offsets the margin drag.
4. SaaS Efficiency Metrics
SaaS Startups are Operating with Leaner Teams
Efficient growth is still the story across SaaS. Since 2022, ARR per employee has climbed in every ARR band, while median headcount has fallen, especially for companies at $5M+ ARR.

Source: 2025 SaaS Benchmarks Report by High Alpha
Teams are running lean both out of necessity, given a tighter fundraising market, and ability, thanks to AI-driven productivity gains. The biggest reductions were in engineering, support, and marketing; IT, HR, and finance saw the smallest cuts.
💡Founder play: formalize “Operation AI” inside the company. Document AI-assisted workflows for support, success, sales ops, and engineering. Track time saved, cycle-time improvement, and defect rates. Report it monthly. Efficiency compounds when you measure it.
High NRR + Low CAC Payback Period = Efficient Growth
The strongest outcomes live where high Net Revenue Retention meets short CAC payback. Teams in that quadrant nearly double growth and Rule of 40 scores versus peers with weaker retention or longer paybacks.
NET REVENUE RETENTION AND CAC PAYBACK PERIOD
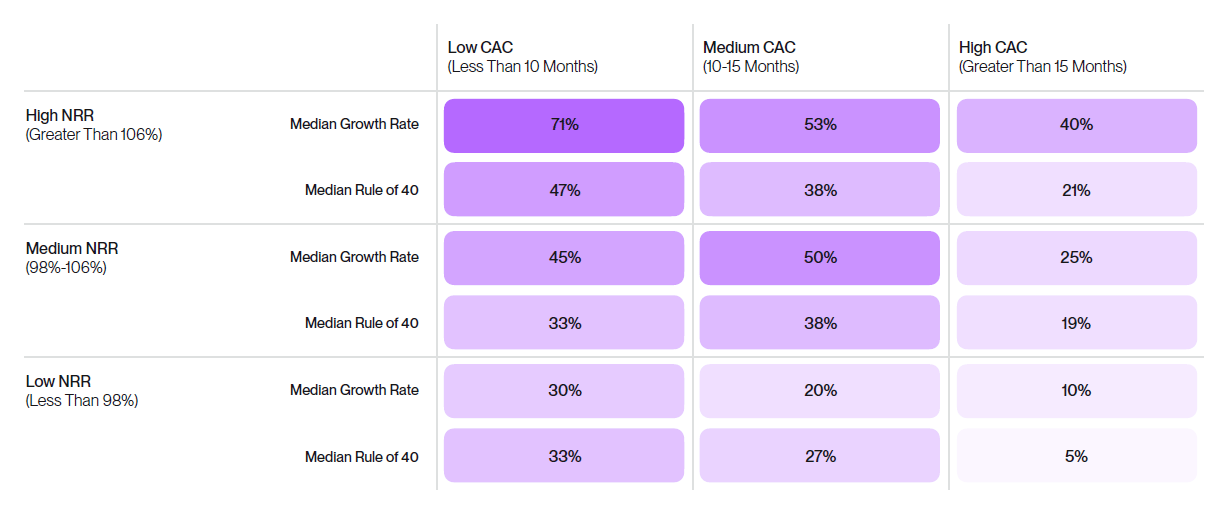
Source: 2025 SaaS Benchmarks Report by High Alpha
5. In-Office Teams Continue To Grow Faster Than Remote
For the second year, default in-office companies reported higher year-over-year growth than remote-first teams, though the Rule of 40 gap is smaller. In-office responses increased 4% year-over-year as companies are recognizing benefits of in-person collaboration.
PERFORMANCE BY COMPANY OFFICE CULTURE
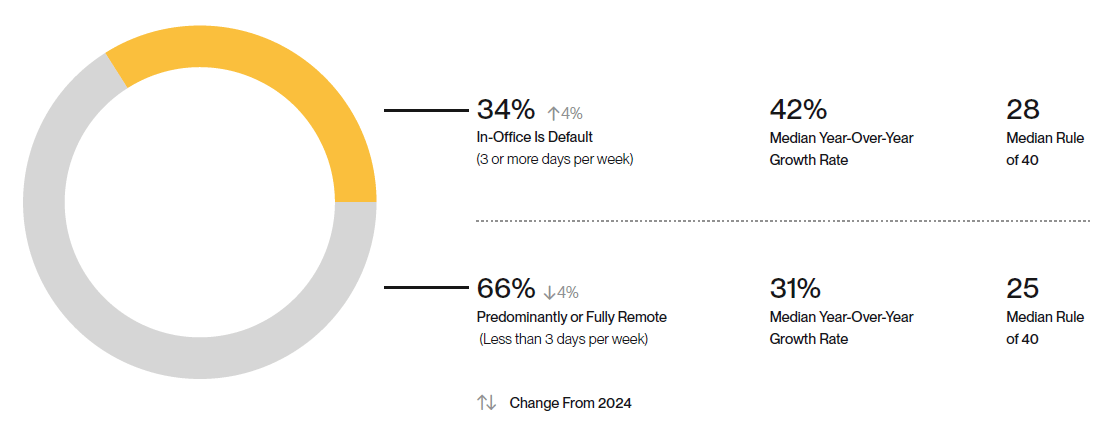
Source: 2025 SaaS Benchmarks Report by High Alpha
💡Founder play: if you’re remote, you can close the growth delta with tighter team enablement and intentional in-person spikes around product and GTM cycles.
Don’t miss these in the full report
There’s a lot more worth your time, including:
- Fundraising success rates and time-to-close benchmarks.
- Which go-to-market channels are working best by stage.
- AI revenue models that are actually converting.
- The correlation between growth rate and founder stress.
- ACV patterns and how they relate to retention.
A big thank you to the 800+ founders and operators who shared data, and to High Alpha with Customers Bank, Growth Unhinged, and Visible for assembling this year’s report. If you build, fund, or advise SaaS, download the full 2025 SaaS Benchmarks Report to see the charts, band-by-band targets, and methodology.
Ready to lift your benchmarks?
Burkland helps SaaS and AI founders measure what matters and move it fast. For a clear, data-driven path to “Great” in your ARR band, contact us.