How to Measure Your SaaS Startup’s Net Revenue Retention (NRR)
Net Revenue Retention (NRR), also known as Net Dollar Retention (NDR) is a key metric for SaaS companies. Measuring NRR provides important insights into a SaaS startup’s retention and expansion rates, which in turn provide insights into both the growth potential and possible financial risks associated with the company.
How to Measure Your Startup’s NRR
NRR essentially measures the percentage change in revenue from a cohort from the beginning to end of any time period. The SaaS Metrics Standards Board provides two methods for calculating NRR; a cohort method and a formula method, with the cohort method the generally recommended method.
Measuring NRR: Cohort Method

Measuring NRR: Formula Method
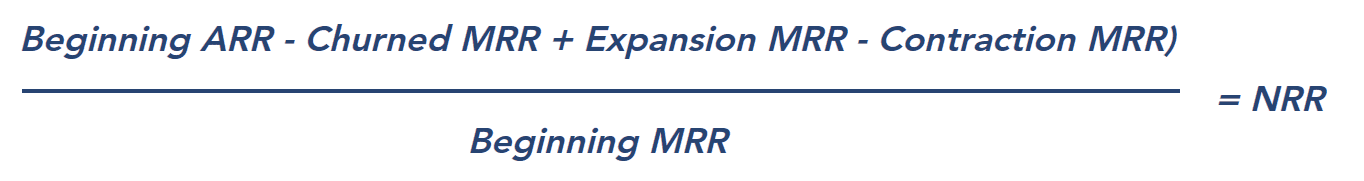
While the cohort method is generally preferred, the formula method is more responsive to churn at SaaS companies with lower transaction amounts and shorter sales cycles, and may offer these companies the easiest way to measure performance over shorter time periods. However, over longer periods of time the formula method can become subject to errors, making it best used for monthly or quarterly tracking.
Benchmarking Your Startup’s NRR
What’s a Good NRR for a SaaS Business?
According to Bessemer’s 2023 State of the Cloud report, 100% NRR is considered Good, while 110% is considered Better, and 120% or greater is considered Best. SaaS companies selling to mid-market and enterprise customers often have a higher NRR due to a land and expand sales motion, where they will make an initial sale to the customer (the land) followed by an upsell or cross-sell over time (the expand). Conversely, SaaS companies selling to SMB and Consumers often drive the bulk of their growth via the initial customer sale, and may not have meaningful upsell opportunities; for these companies an NRR of 110%, or even 100% may be considered best-in-class.
For some real-world examples, we can look to SaaStr’s What’s a Good Net Retention Rate in SaaS?, which provides benchmarks from some of the top public SaaS companies. On the low end we see names like Squarespace at 85% NRR, and Shopify, HubSpot, and SurveyMonkey all around 100% NRR. On the other end of the spectrum Snowflake clocked 169% NRR at IPO, and Slack and Zoom both have NRR around 140%.
NRR at Very Early-Stage SaaS Startups
As with other SaaS finance metrics like ARR and LTV:CAC, standard NRR formulas aren’t always the optimal metrics for the earliest stage startups. I’ve found that when working with very early stage startups, there usually isn’t enough data for NRR to be a completely reliable metric. In particular, for SaaS startups that have less than $3MM ARR and/or fewer than a couple dozen customers, I’ve found that I rely more on Momentum ARR tables as a way to gauge a startup’s retention profile.
Building a Momentum ARR Table
A Momentum ARR table breaks out monthly ARR growth into four components:
- New ARR: Increase in ARR driven by onboarding new customers during the month.
- Expansion ARR: Increase in ARR driven by growth from existing customers during the month. Expansion can be driven by a variety of factors, including product upgrades, an increase in user counts, and price increases.
- Contraction ARR: Decrease in ARR driven by declines from existing customers who remain customers at the end of the period, but at a lower ARR.
- Churned ARR: Lost ARR from churned customers during the month.
Example Momentum ARR Table
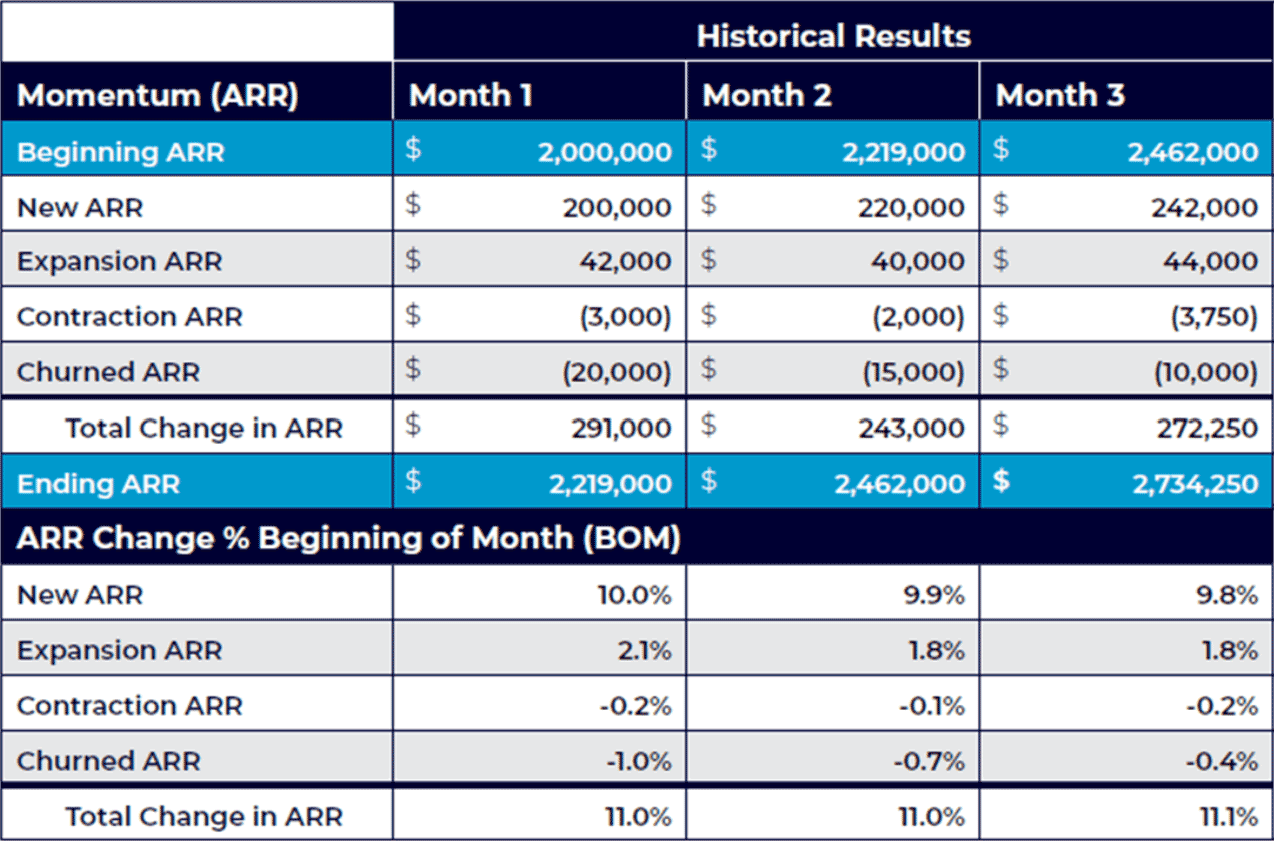
As different factors drive each of these growth components, it is important to forecast them separately. An ARR momentum table tells a lot about a company’s revenue model and growth prospects.
SaaS companies that are focused on a land and expand growth model will have a large proportion of their growth driven by expansion over time, whereas other companies may have growth primarily driven by new customers.
Companies that have lower levels of churned ARR as a percentage of their beginning ARR are better at retaining their customers, and thus have longer customer lifetimes.
In addition to looking at the ARR dollar movements in an ARR momentum table, it is also typical to view the changes in ARR and its components as a percentage of the ARR at the beginning of the period. Understanding how these percentages move over time is key in drawing insights into the company’s growth and net retention profile.
Related Resources