Pitch Deck Math: Telling Your Startup’s Story with Metrics
$100 Billion in TAM. $5 million ARR. 5.6 LTV to CAC ratio. $34,000 contract value.
Huh? Exactly.
These are metrics we hear and see all the time related to raising startup capital. But alone and without context, numbers can confuse your investor and fail to show your startup’s actual value. A great pitch deck shares the customer journey supported by metrics and numbers that show the true value of your investment opportunity.
Marry Metrics & Storytelling in Your Pitch Deck
Metrics by themselves don’t move investors. Here’s why:
- Numbers and data alone often fail to create vivid pictures in our heads – concrete images are the key to relating numbers to peoples’ lives and making them memorable.
- It often isn’t easy to judge the size or meaning of numbers; we need cues and familiar concrete comparisons. Using metaphor and analogy is key to translating metrics into meaning.
- When your data is missing a story or context, investors can misinterpret it in a way that counters the message you’re trying to get across.
- Once a particular perspective is established in our minds, it will trump the data – one wrong number will turn the investor’s “yes” equation into “no” in an instant.
Four tips for making your pitch deck numbers count:
- Hitch numbers to your customer and startup journeys. Paint a vivid picture of your customer and their problems, then back it up with supporting data.
- Show your growth and your path to scale using concrete metrics and trendlines using graphs.
- Become a “financially fit founder” by using analogy to relate specific startup metrics to what’s familiar and concrete.
- Sometimes graphs tell the best story. Graphs can show multiple data points with trendlines, framing your metrics instead of making them work alone with little context.
Start Your Pitch Deck with the Customer Persona & Journey
Present your statistics and metrics within the context of your startup and customer journeys. Paint a vivid picture of your customer and their problems, then back it up with supporting data.
Unless metrics are married to a cohesive story, they are unlikely to mean much to the investor. Without the story – or meaning – upfront, people automatically default to preconceived notions and assumptions based on their own life experiences.
For example, a consumer product brand focused on a student persona may have trouble painting the customer journey to a VC who’s hasn’t been a student in 20 years and may have old notions from when they were younger. Without modern personas of the new student (hours spent on their mobile phone, how much they spend on technology, number of keg stands completed, etc.), the investor may imagine smaller numbers than reality in 2021. Informing the investor of your customer persona and providing a clear understanding of your ideal customer profile (ICP) will go far.
- Start with a customer persona that shows you’re familiar with their problems and market. As you build your “persona”, you’re developing a character, a protagonist, with their own journey. What’s keeping your customer from achieving success? Think about your customer as a real person with real-life obstacles and challenges, and use math and metrics to support their persona’s journey. Numbers can include demographics that show the founders understand their customers from an ICP perspective. Example: A saas startup, ConstructTIME, sells appointment software to contractors. They want to build out the SMB contractor vs. Enterprise customer in their deck. They highlight two personas – Bob the Independent Contractor and Jack the Construction Site Manager. They highlight how many hours each persona spends setting appointments, how often they miss appointments, and similar numbers that illustrate how much of a burden their software will solve.
- Build out the impact these problems have on your customers. How much time and money is this problem costing them? What effect does that have on their life? This is a chance to get more emotional with your storytelling. This is a chance to really think about the impact your solution has. The bigger the impact, the more the emotion will convey in the deck. Example: Bob spends 15% of his time, or 5 hours of his week, booking appointments. He’d rather be spending his time on the job earning, or with his family.
- Add Additional Data for Insights and Impact if it adds to the calculation of your TAM data. Additional data might include market research, customer surveys, or industry data that points to a problem. Always cite your source. Example: A survey of 1,500 contractors claimed appointment setting is their biggest challenge, spending 6 hours per week, with 60,000 contractors nationwide, that’s 18.72 million hours our software can save every year.
Your Solution Solves a Customer Problem
One of the most important illustrations in your pitch deck should be about your expertise to execute the solution to your customer’s big (and costly) problems. Your expertise includes not only understanding your customer and the market, but how to acquire and retain customers at a low cost. Start with how you plan to solve the challenges directly related to the problem slide. What impact does your solution have on the customer? This should relate directly back to your impact slide. Numbers may include:
- Time saved using your product
- Cost savings using your product
- How many people in the organization are positively impacted by your solution
Example: Bob reduced his appointment setting time to 1 hour per week. He’s spent the additional 4 hours on new jobs that have yielded $9,360 in additional profit per year.
Traction
Next, you’ll want to highlight the traction your product has already received. Showing high average customer ratings and great testimonials can go a long way in telling the emotion. Match the quote to the impacts – have a customer directly tell the investor that your software is the solution to their problem and how it impacts their business. Next, match the person quoted to the persona, making sure the job title and company fit your ICP.
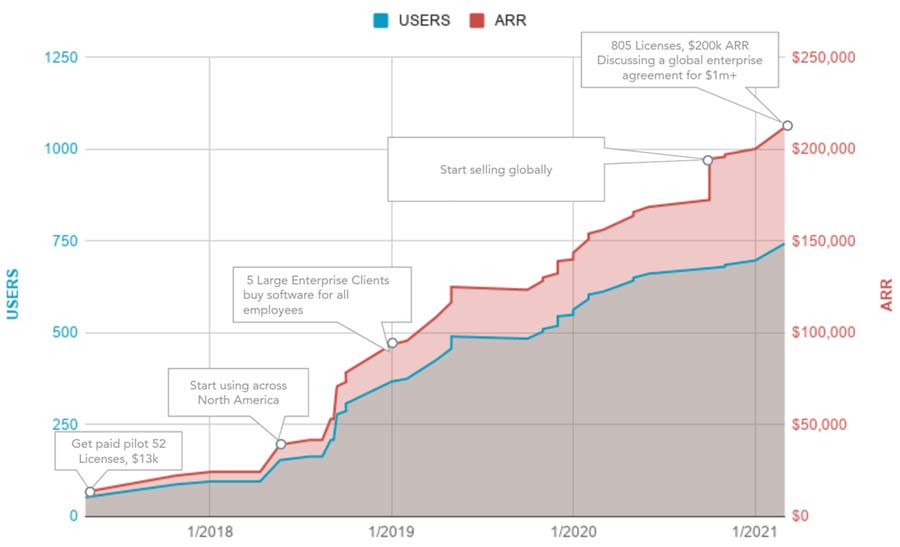
Traction slides should include graphs that show how your product has increased in usage, ARR, or a meaningful metric that shows growth. Adding call-outs as points along the growth curve can help tell this story. This slide should also plant a seed for the investor on how you plan on growing revenue in the future and how much exact capital you’ll need to get there based on our following slides.
- % industries served, SMB – Enterprise % of customers
- Who are you targeting (C-Suite, Managers, etc.)?
- Adoption rates
- Hours spent on platform
- Engagement on the platform – how many customers are they helping, product ratings
Example Customer Journey: ConstructTime
Customer Channels and Acquisition Cost
If done correctly, this is your magic slide—the slide that makes the investor want to invest now. Customer channels and acquisition costs should build off the ICP – how much does it cost to acquire this specific customer, and what online and offline channels are you using? Are these repeatable strategies? The assumption is that you’ll maximize these channels and expand to new ones as the company grows. Your objective of this slide is to show that in the next phase of business, you want to take advantage of these low acquisition costs to acquire as many ICP’s as possible. If framed correctly, this slide will help prompt the investor to understand that this opportunity is timely – this acquisition cost is elastic. As competitors enter the market, it will go up. Now is the time to create your competitive advantage and become a dominant player.
In your traction slide, you’ll want to show the ease with which you obtain your ICP at a competitive cost, using specific channels. Many companies will use a “funnel” slide.
Note: You can complement this slide with any channel-specific partnerships that may give your company lower cost, competitive advantage, or exclusivity rights.
All Roads Lead to Total Addressable Market
Who is your customer, how many are there, and how much is their lifetime value? Your total addressable market tells a story—the story of how many customers your startup believes it can scale to, if capitalization helps you execute your vision.
All customer slides lead to TAM. A great pitch deck starts with the customer persona and uses the numbers to gently guide the investor to the investment opportunity: how big is the market, and how much of it can a startup actually capture?
Start with who your customer is, what an average persona looks like, and how much this problem is costing them in time, money, and resources. Create an impact slide that clearly shows the investor this is a costly problem that the target customer has a strong incentive to solve with your product.
Metrics that should build to your TAM include: Pricing, Lifetime Value, customer acquisition costs.
The Funnel
You’ve proven there’s a customer problem, demonstrated the cost of that problem, and shown the market opportunity. Now it’s time to show the investor you have more customers waiting and give an idea of how long it takes to convert them. Again, the investor has an intuitive understanding of all these numbers. The more valuable information your pitch deck provides to fill in the equation, the more likely you will get exactly what you’re asking for. Your funnel is critical to show that you have more potential customers and understand the timing and effort it takes to convert them.
What you’ll want to include in your funnel slide:
- Sign-ups
- Conversion Rates
- Customers
- Close Ratio
- LTV/CAC
- Sales Cycle
The Ask
Everything has been leading up to this point – how much capital it will take to achieve the growth you’re promising to see a return. Your ask should be specific, based on all the information you’ve provided, and have timeframes when you need the capital.
- How much of your spend will be on customer acquisition? If you’ve done your job well, the investor will know that your customer acquisition cost divided by this amount should yield X amount of customers multiplied by LTV.
- How much will you spend on employee growth? This will show how well you understand your market and if you’re in tune with how much it will cost to grow in a competitive employment market.
With these recommendations, your pitch deck will share a customer journey with compelling metrics and numbers that communicate the true value of your investment opportunity.